

| US Fuel Economy Standard | Miles per gallon (MPG) (U.S. Environmental Protection Agency) |
| International Fuel Economy Standard | Liters per 100 km (L/100km) |
| Conversion Formula | L/100km = 235.21 ÷ MPG |
| Number of EPA Test Cycles | 5 cycles (U.S. Environmental Protection Agency) |
| AC Impact on Fuel Economy | 5-25% reduction (U.S. Department of Energy) |
| Speed Threshold for Significant Drag | Above 50 mph (U.S. Department of Energy) |
MPG and L/100km: What Each Metric Actually Measures
Two dominant fuel economy metrics are used around the world, and understanding how they relate helps you evaluate vehicle efficiency more precisely.
Miles per gallon (MPG) is the US standard: it tells you how many miles a vehicle travels on one gallon of fuel. Higher is better. A vehicle rated at 35 MPG travels farther on the same gallon than one rated at 25 MPG.
Liters per 100 kilometers (L/100km) is used in Canada, Europe, and much of the rest of the world. It measures how many liters of fuel are consumed per 100 km traveled. Lower is better - a rating of 6 L/100km is more efficient than 9 L/100km.
To convert between them, use this relationship: L/100km = 235.21 ÷ MPG. So a vehicle rated at 30 MPG is roughly equivalent to 7.8 L/100km. This conversion matters when comparing international vehicle specs or reading imported vehicle documentation.
For deeper context on how gasoline engines generate - and lose - efficiency before fuel ever becomes forward motion, see how modern engines use gas.
| US Fuel Economy Standard | Miles per gallon (MPG) (U.S. Environmental Protection Agency) |
| International Fuel Economy Standard | Liters per 100 km (L/100km) |
| Conversion Formula | L/100km = 235.21 ÷ MPG |
| Number of EPA Test Cycles | 5 cycles (U.S. Environmental Protection Agency) |
| AC Impact on Fuel Economy | 5-25% reduction (U.S. Department of Energy) |
| Speed Threshold for Significant Drag | Above 50 mph (U.S. Department of Energy) |
How EPA Fuel Economy Estimates Are Generated
In the United States, the Environmental Protection Agency (EPA) oversees the standardized testing that produces the fuel economy estimates printed on new vehicle window stickers (Monroney labels). Understanding this process explains why sticker numbers don't always match your experience.
The EPA uses a set of five driving cycles to simulate different conditions:
- City cycle: Low-speed stop-and-go driving, frequent idling
- Highway cycle: Steady speeds averaging around 48 mph
- High-speed cycle: Aggressive driving, speeds up to 80 mph
- Air conditioning cycle: AC on, warm ambient temperatures
- Cold temperature cycle: City-style driving at 20°F
Manufacturers typically conduct tests on a dynamometer (a stationary roller system that simulates road load) and submit results to the EPA. The EPA then audits a portion of those submissions independently. The city and highway figures on the sticker are derived from a weighted combination of these test cycles.
One important nuance: sticker estimates reflect controlled laboratory conditions. Real roads, real weather, and real driver behavior introduce variability the test cycles can't fully capture.
MPG (Miles Per Gallon)
A US measure of fuel economy expressing how many miles a vehicle can travel on one gallon of fuel. A higher number indicates greater efficiency.
L/100km (Liters per 100 Kilometers)
An international fuel consumption metric showing how many liters of fuel are used per 100 kilometers traveled. A lower number indicates better efficiency.
EPA Fuel Economy Estimate
The standardized fuel economy figure generated through EPA-prescribed test cycles and displayed on new vehicle window stickers in the United States. It represents controlled lab conditions, not guaranteed real-world results.
Dynamometer
A stationary machine used during fuel economy testing that simulates road load on a vehicle's wheels without it physically moving. It allows controlled, repeatable measurements of engine output and fuel use.
Rolling Resistance
The friction force that opposes a tire's motion against the road surface. Higher rolling resistance - caused by under-inflation, tire design, or road texture - requires more engine effort and increases fuel consumption.
Driving Cycle
A standardized sequence of speed and braking patterns used during laboratory fuel economy testing to simulate real-world driving conditions such as city stop-and-go or steady highway travel.
Why Real-World MPG Diverges From EPA Estimates
Most drivers notice their actual fuel economy falls short of the EPA estimate, sometimes by a meaningful margin. Several factors drive this gap:
- Speed: Aerodynamic drag increases exponentially with speed. Driving consistently above 70 mph can reduce highway MPG by 15-20% compared to test cycle speeds.
- Cold starts and short trips: Engines operate inefficiently until they reach normal operating temperature. Frequent short trips - under 5 miles - never allow full warm-up, burning more fuel per mile.
- HVAC use: Air conditioning places a direct load on the engine, reducing fuel economy by roughly 5-25% depending on vehicle type and conditions, according to the U.S. Department of Energy.
- Cargo and passenger load: Additional weight requires more fuel to accelerate and maintain speed.
- Road grade and terrain: Consistent uphill driving and mountain routes consume substantially more fuel than flat terrain test cycles simulate.
- Tire pressure: Under-inflated tires increase rolling resistance. For a closer look at this relationship, see how tire pressure affects fuel economy.
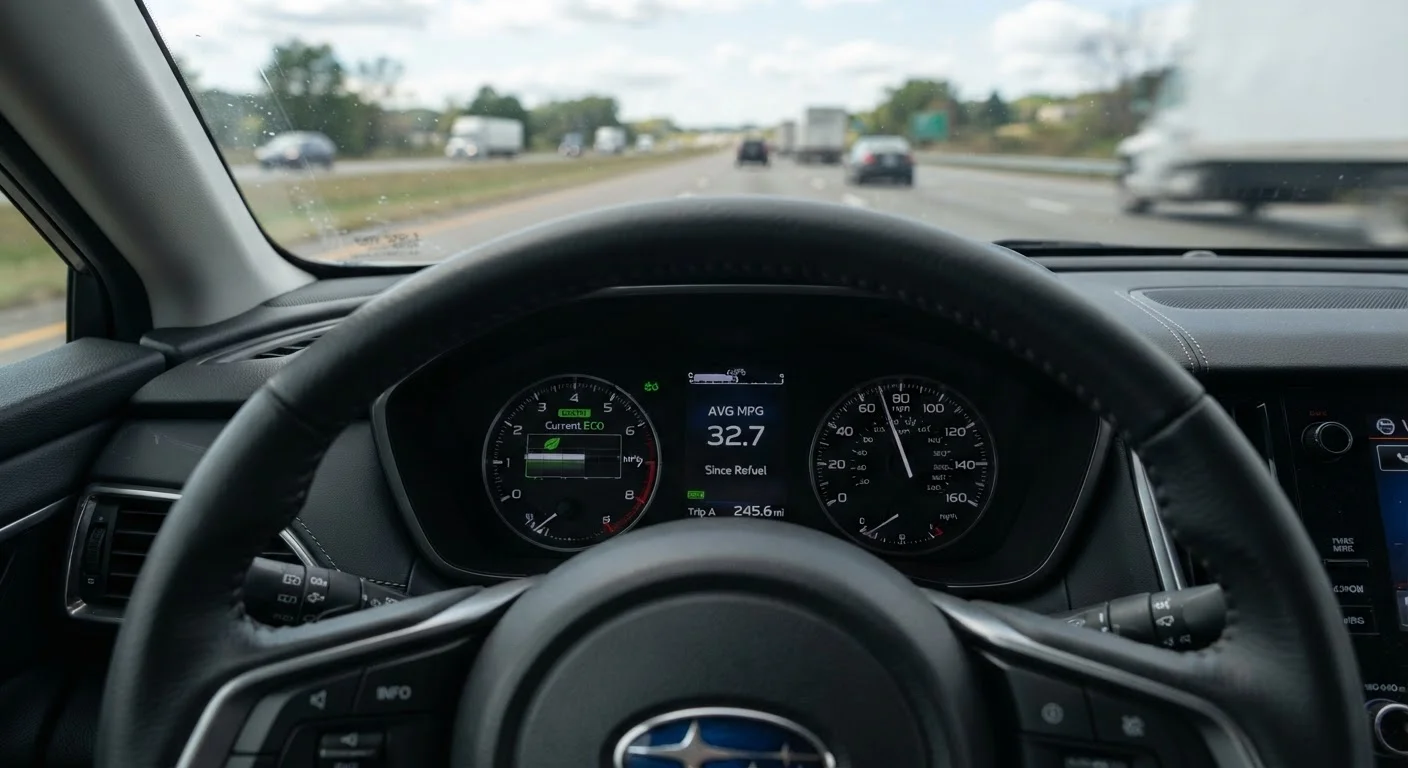
Your vehicle's onboard computer can help you track real-time and average efficiency. Reading your car's fuel economy display accurately is a skill worth developing.
Before acting on popular fuel-saving tips, it's worth checking what actually holds up. Common fuel economy myths can lead to wasted effort - or wasted money.